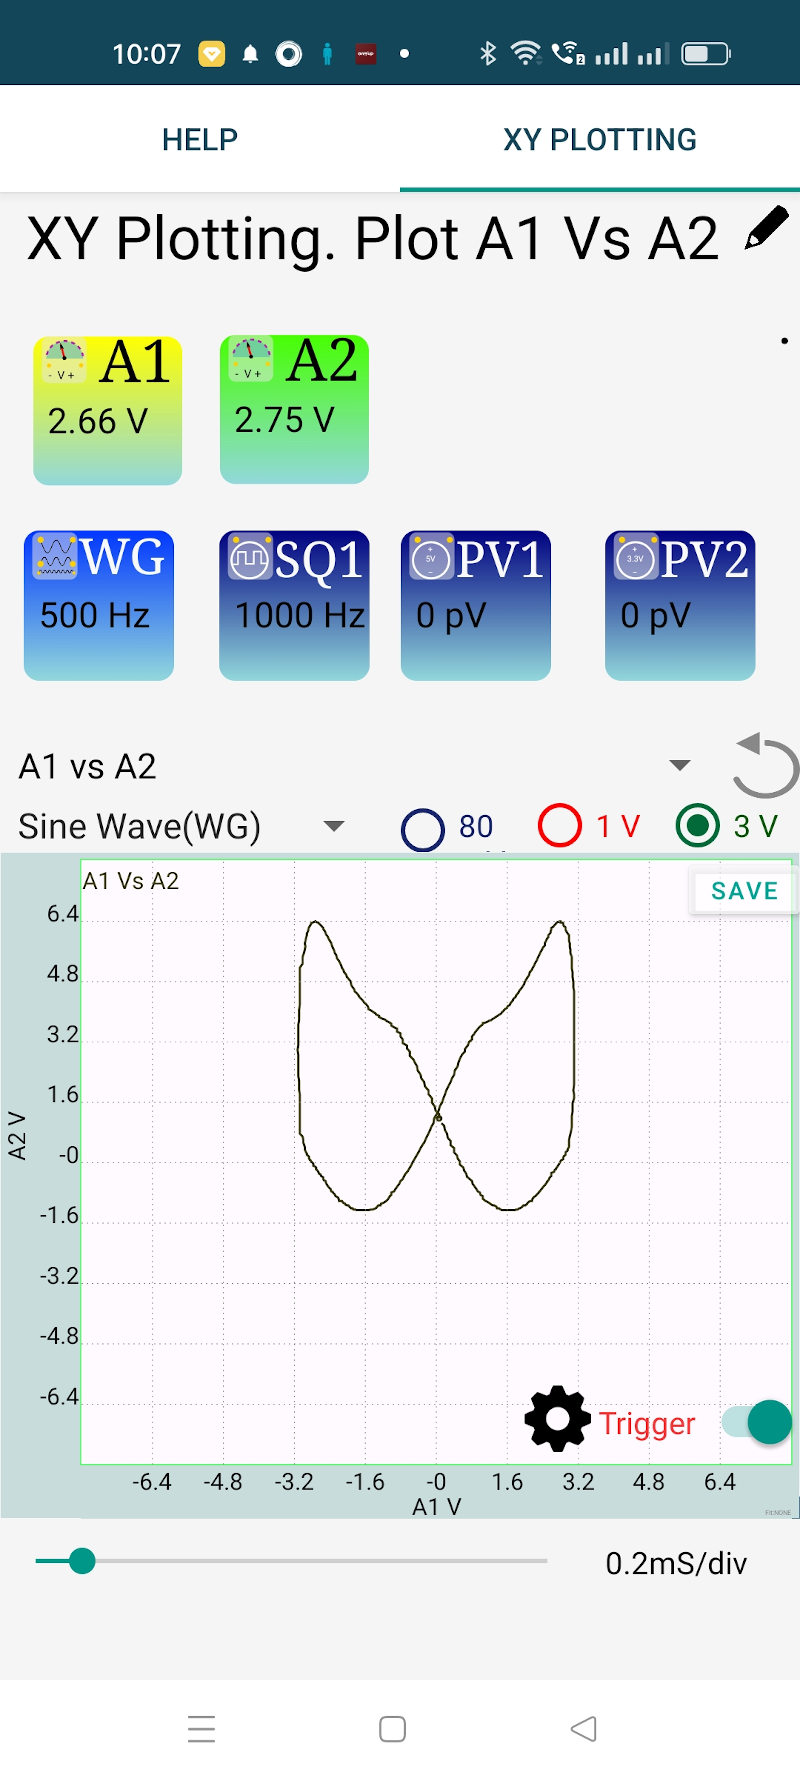
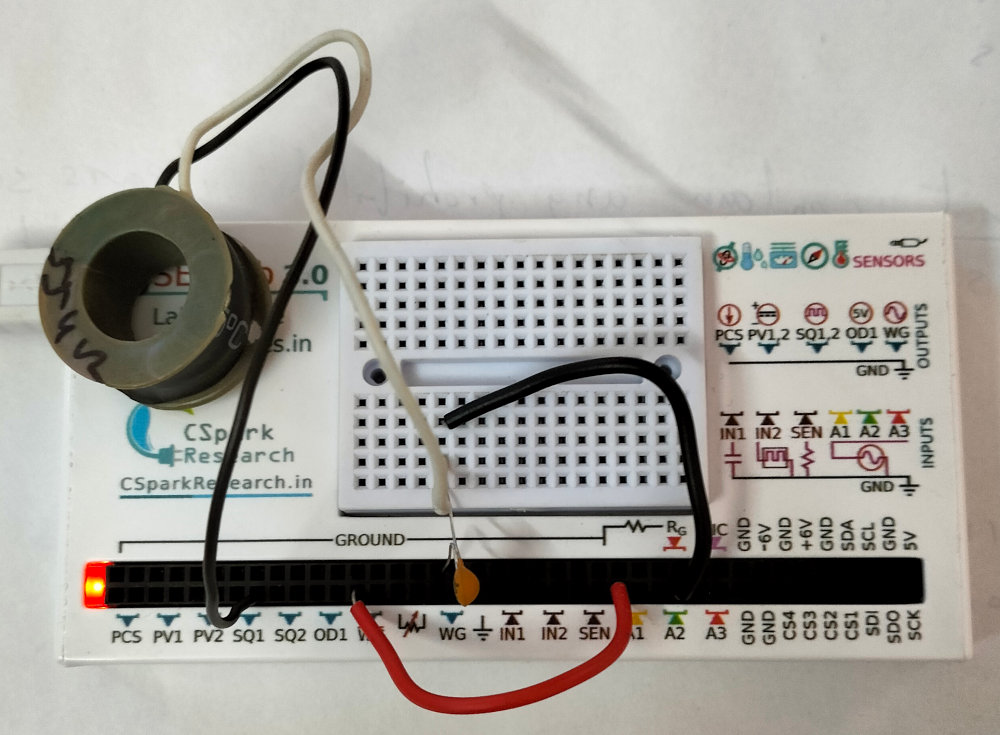
The input A1 is plotted against A2. Lissajous figure shown below is obtained by plotting 500 Hz sine wave against a 1000 Hz square wave after passing through an LC low pass filter.