Experiments
About
Reources
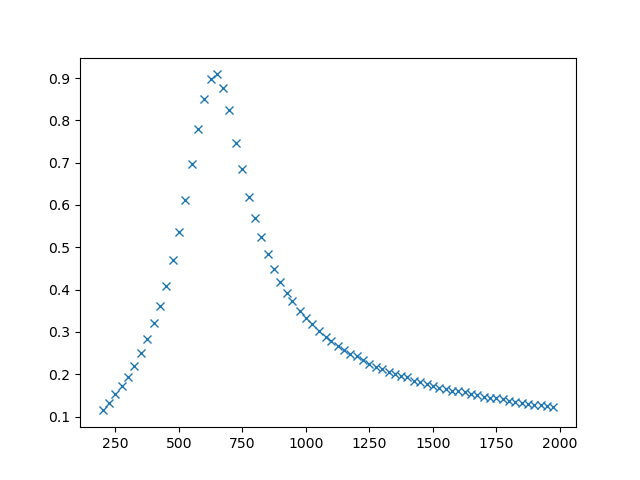
Circuits with a response that depends upon the frequency of the input signal are known as filters. We can study them using the frequency and phase response plots. We are using active filters in this example. The schematic of the filter circuit is shown in the screenshot below. The values chosen are
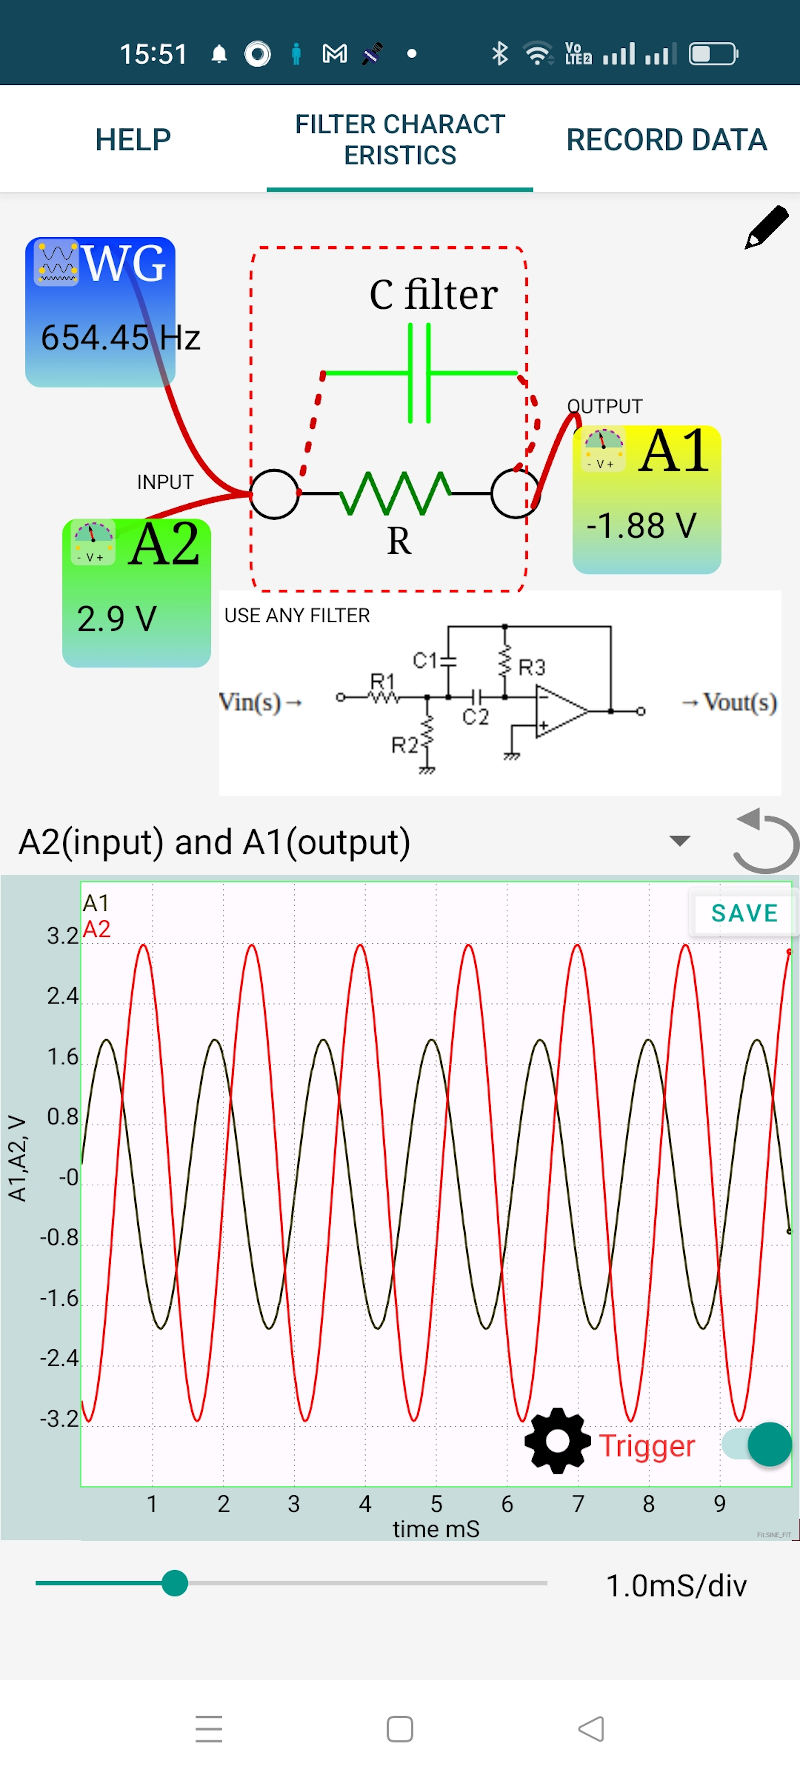
It is designed using an Online Tool. The calculated resonance frequency is 527.8 Hz, very close to the measured response. The first screen shows the input and output waveforms. Sliding vertically on the WG icon changes the frequency and we can view the change in the output amplitude with frequency. On the second screen (Record Data) specify the frequency limits and stepsize to generate the gain and phase plots. Design in such a way that the gain is less than one.
The design given is just an example and you can study other types of circuits as well. The limitation is the frequency range of WG, 5 Hz to 5000 Hz only.
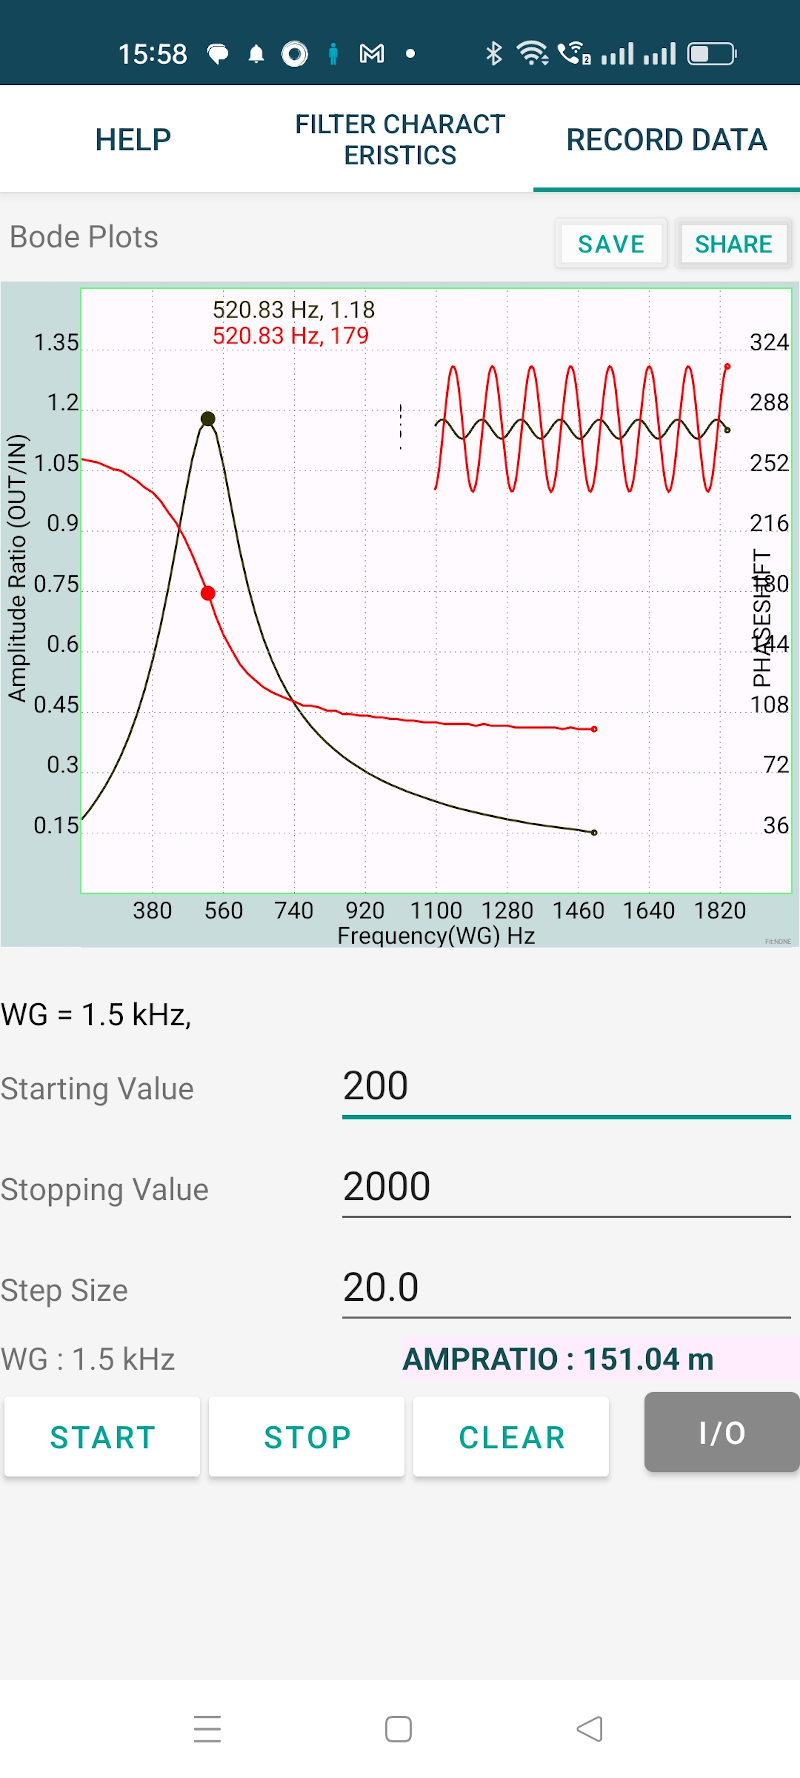
The connections are made as shown in the figure below.
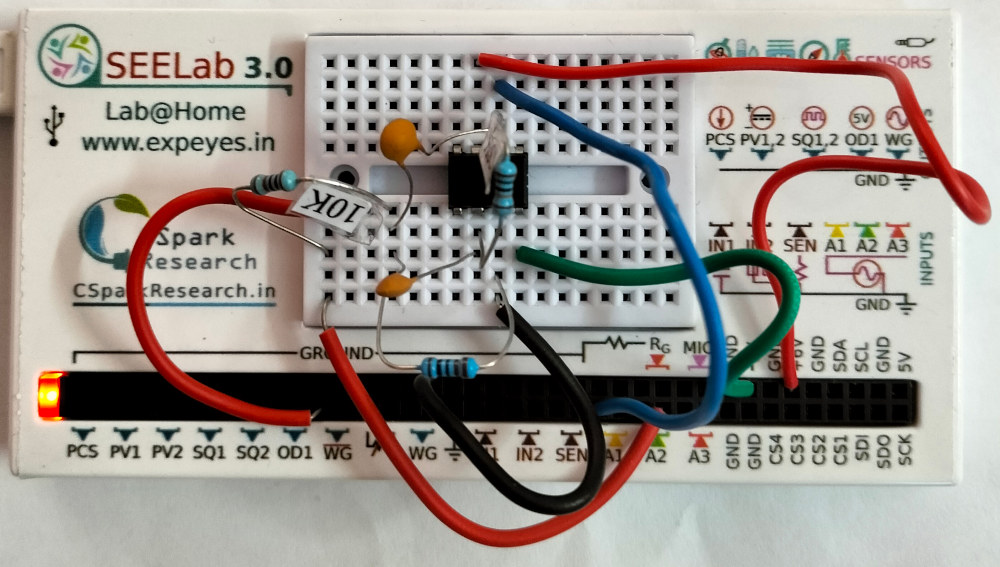
The same experiment is repeated using a Python program. The steps for performing this experiment manully are:
The program just implements these steps to save time, and also improves accuracy. For extracting phase information, we need to mathematically fit the data.